


We Need to Chill Out: Reducing the Heat Island Effect Through Design

In the summer of 2023, many areas across the United States experienced their hottest recorded temperatures in history. Record breaking temperatures are especially prevalent in southern regions like Texas, which experienced temperatures above 100°F for 27 consecutive days1. If this trajectory continues, residents in these areas could see more than 70 consecutive days with the heat index topping 100°F in coming years2.
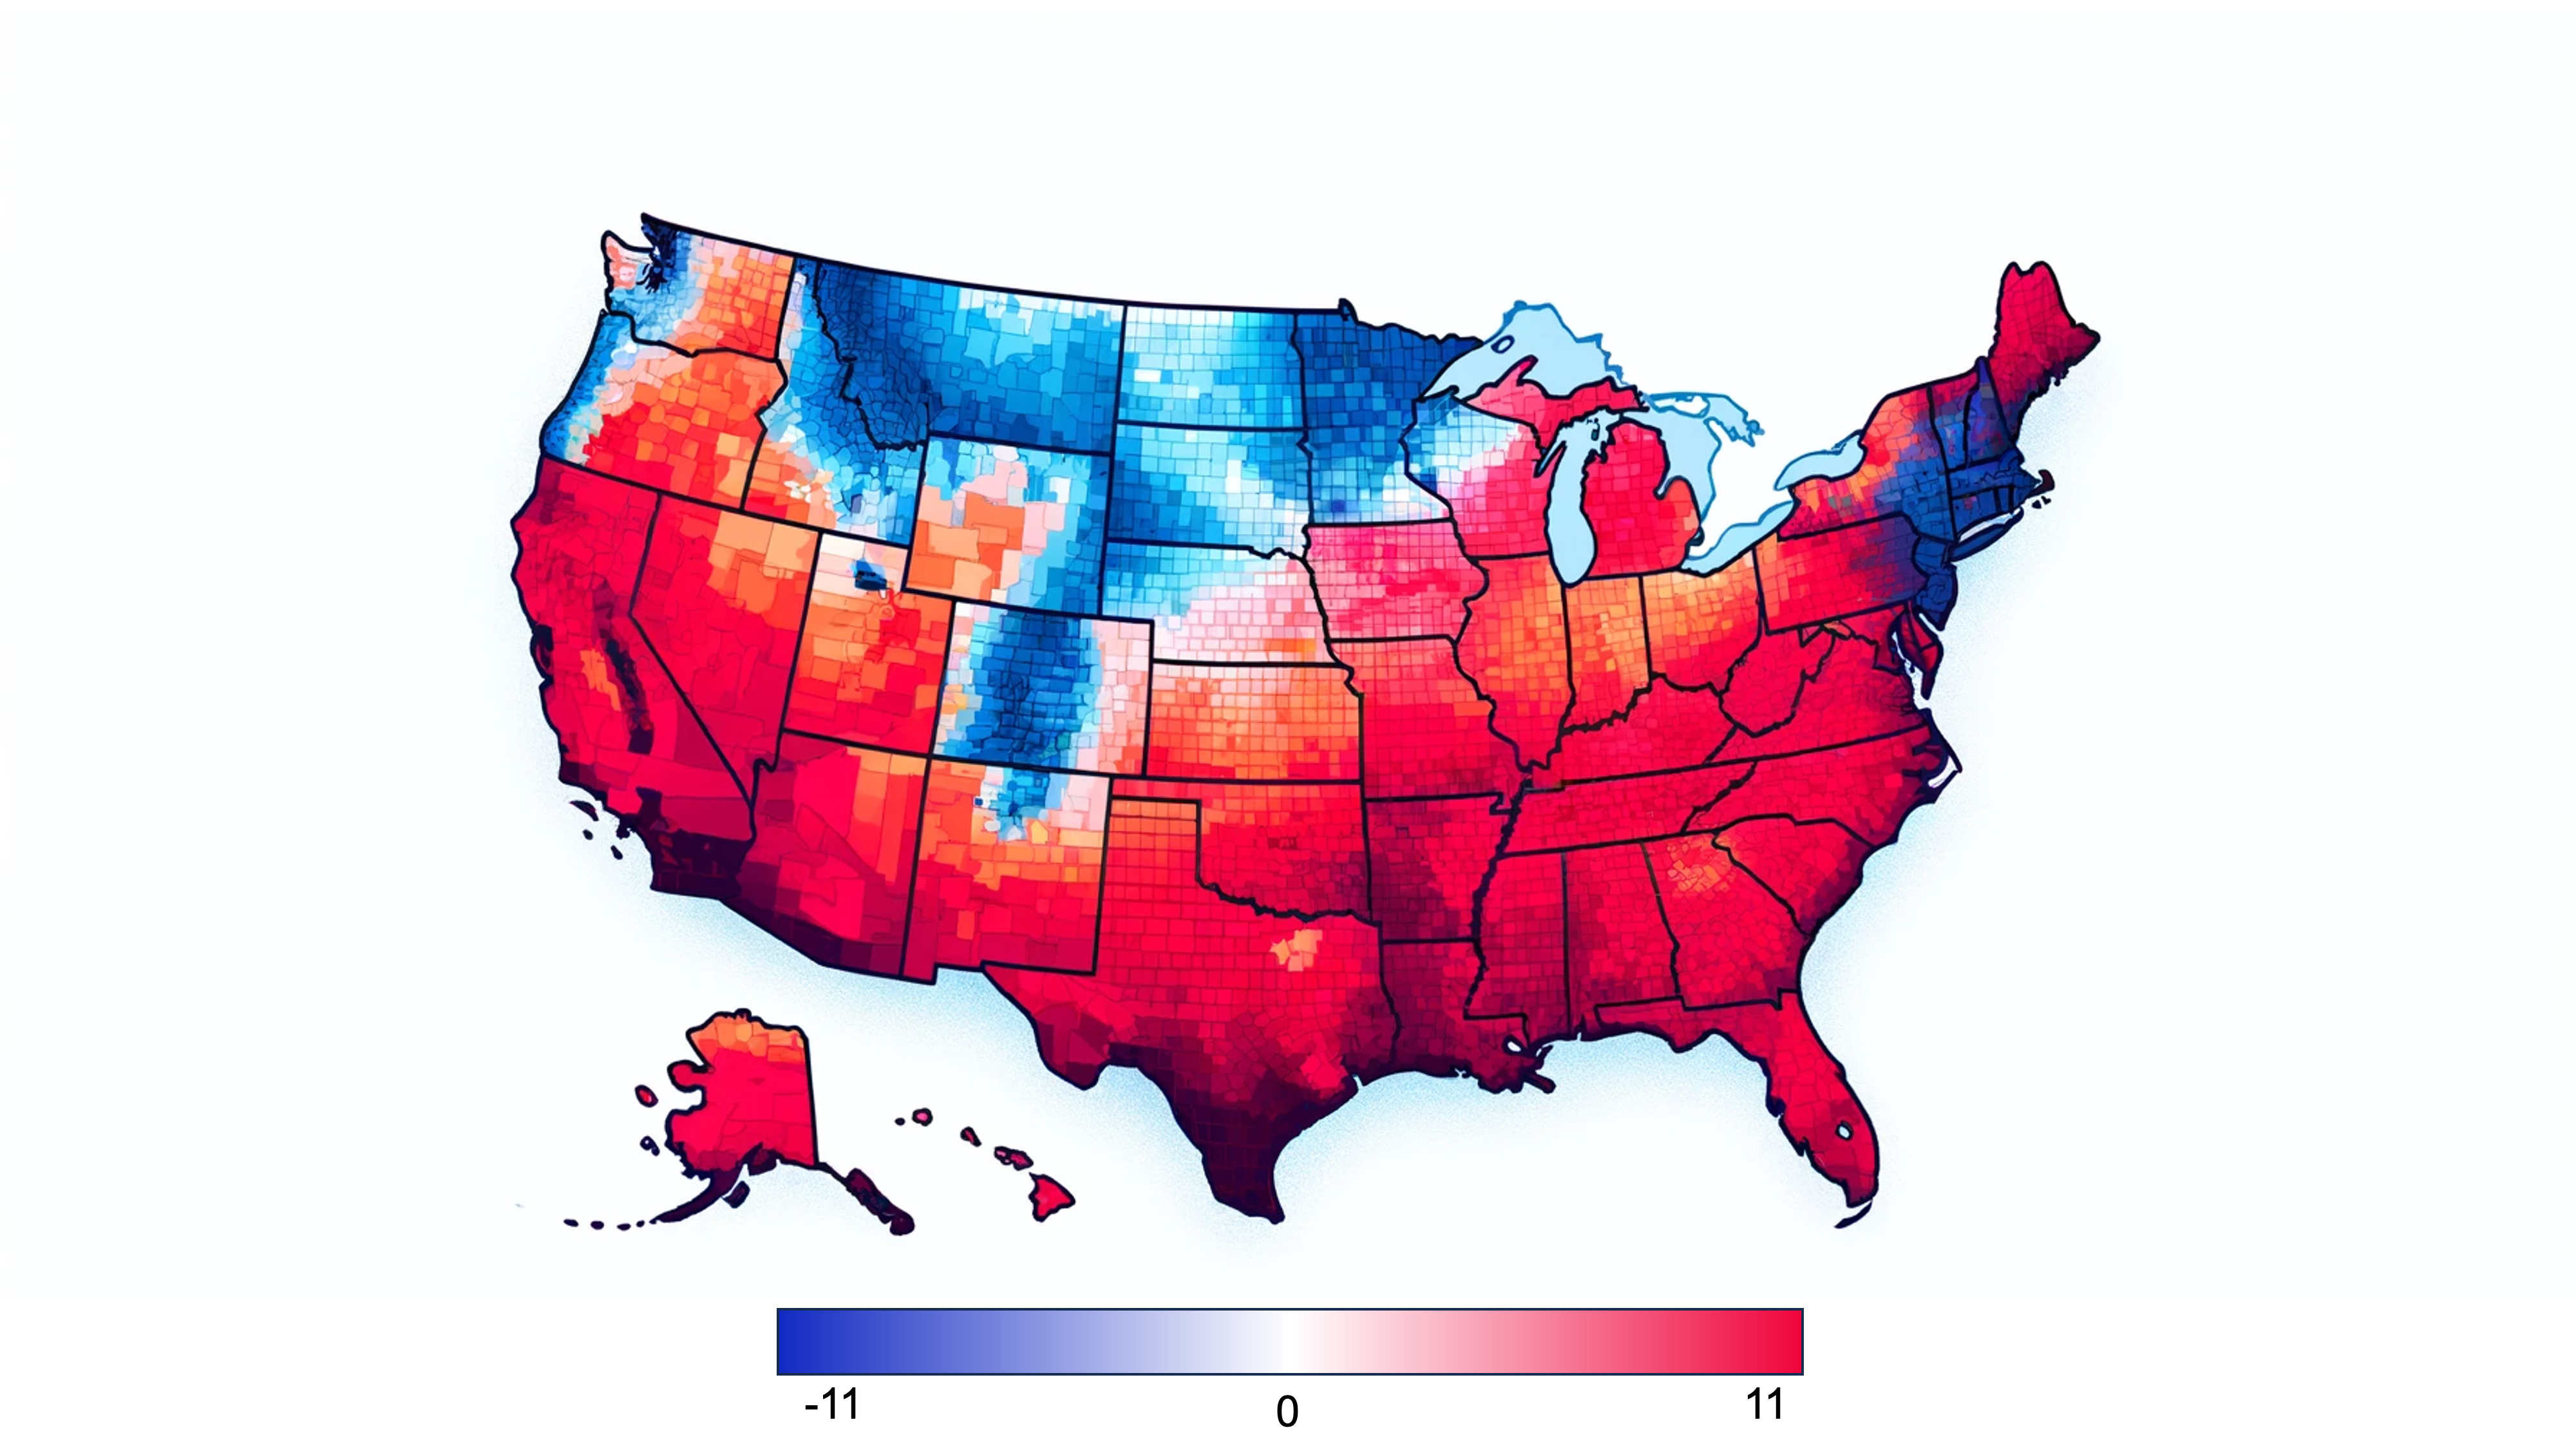
Image from NOAA National Centers for Environmental Information 3.
City Radiance: The Thermodynamic Tango
Urbanization - characterized by tall buildings, roads, and parking lots - exacerbates heat absorption compared to green spaces. Despite covering only 1% of the Earth's surface, cities consume 78% of global energy and accommodate over half the world's population, contributing to the urban heat island (UHI) effect, making cities hotter than rural areas. The UHI leads to increased energy consumption, higher air conditioning costs, worsened air quality, and heightened greenhouse gas emissions. Public health suffers as UHI exacerbates heat-related illnesses, particularly impacting vulnerable groups with preexisting cardiovascular and respiratory conditions.
Understanding how to measure the nuanced relationship between heat, lifestyle, and UHI while also creating positive change means collaborating with urban planners, policymakers, architects, and community stakeholders toward the development of effective mitigation and adaptation strategies to reduce UHI.
We’re Gonna Need a Bigger Earth
If current urban planning and building design practices remain the same, the 2023 record-breaking summer will be normal by the middle of the century. According to Figures 1 and 2, this means that by 2053, the number of counties in the Midwest that will mark a heat index of 125°F will increase 20 times. The heat index signifies how hot it feels to the human body when both air temperature and humidity are considered. Extremely dangerous heat conditions where heat and humidity combine can cause the human body to lose its ability to naturally cool itself through sweating4, and therefore, may increase the probability of heat strokes.
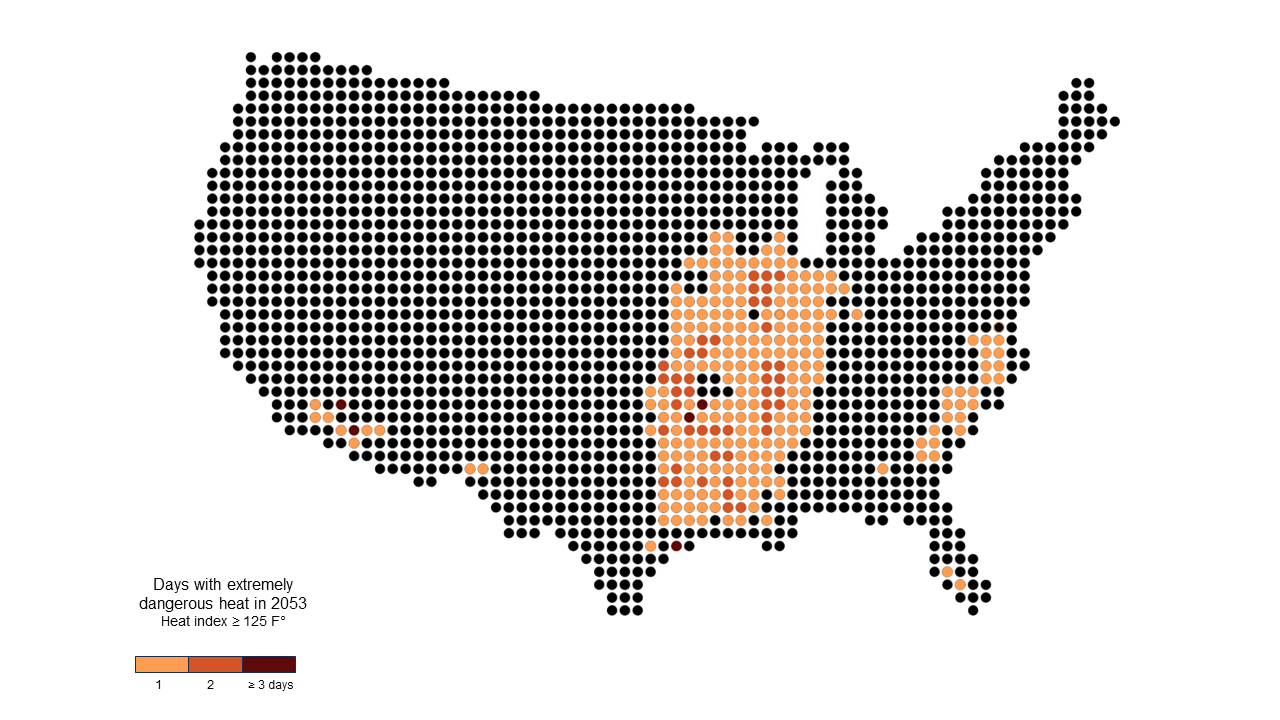
Image from Washington Post 5
Image adapted from One Street Foundation 6
In addition, consecutive heat waves can also damage major infrastructure such as train tracks, highways, and airport runways5, causing catastrophic economic loss. To avoid irreversible damage, the average global temperature should not pass the threshold of a 2.7°F increase7.
The Silent Serial Killer
Continual heatwaves not only destroy infrastructure and the environment, but it is also detrimental for human health. According to Centers for Disease Control and Prevention, heat related fatalities in the U.S. have seen a 253% increase since the beginning of the new century 9. This includes fatalities from heat stroke, hyperthermia, respiratory issues, or cerebrovascular complications 10.
According to American Psychiatric Association, severe heat can adversely influence behavior leading to heightened irritability, aggression, and depression, which have been linked to an increase in domestic violence incidents and escalated substance usage. Studies have also established a connection between elevated temperatures and issues concerning memory, concentration, and response speed 11.
Physical Health Issues

Heat Stroke
Heat stroke, the most severe heat-related disorder, occurs when the body’s temperature regulation falters. Body temperature rises abruptly, above 103°F, as the body’s cooling mechanism fails, leading to dry skin, confusion, and sometimes unconsciousness. Without prompt medical intervention, it can lead to death or permanent disability 12.

Respiratory Problems
Higher temperatures lead to more ozone pollution, also known as smog. The Ozone particles can attack lung tissue and act like a sunburn for the lung 13.
Mental Health Issues

Rage
As the temperature increases above 90°F, hostility and rage exhibited by people in outdoor settings increases nonlinearly 14 . As a matter of fact, X (formerly known as Twitter) sees hate tweets and online aggression increase during heatwaves.

Sleep Deprivation
Heat can disrupt normal sleep cycles. As nighttime temperature rises above 77°F, quality of sleep rapidly declines 15. Additionally, prolonged exposure to high temperatures can increase stress and anxiety, which impact a person’s ability to sleep.
If You Build It Poorly, Heat Will Come
Buildings directly impact the temperature of their surroundings. To better understand this, Corgan-Hugo analyzed temperature data gathered by the National Centers for Environmental Information 16 over the last 30 years (1991-2020), from two weather stations in Dallas, Texas. As shown in Figure 5, the weather stations A [ Dallas Love Field] and B [Redbird] are in the north and south side of the city, respectively. Weather station A is in a dense neighborhood, while weather station B is in a suburban part of the city.
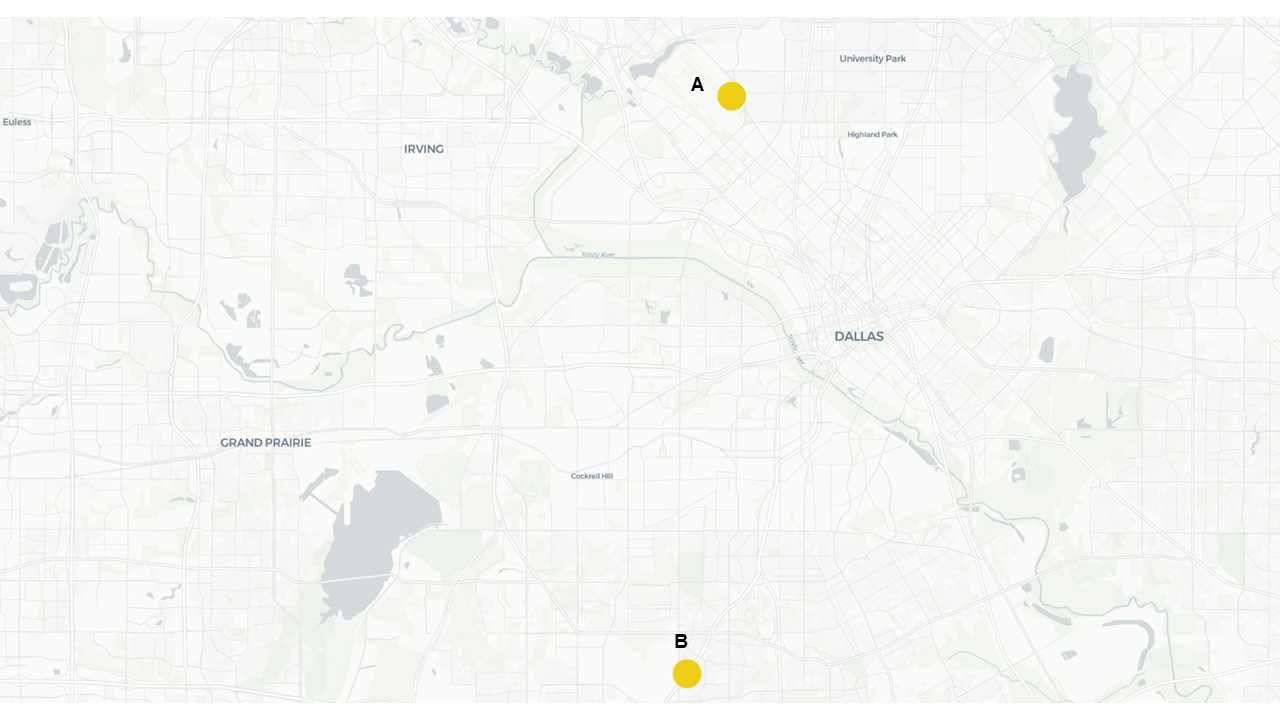
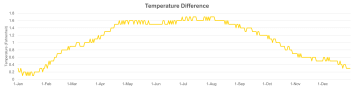
Figure below shows the temperature difference recorded for these stations throughout 2023. Weather station A shows a higher recorded temperature throughout the year, reaching around 1.5 degree difference in the summertime.
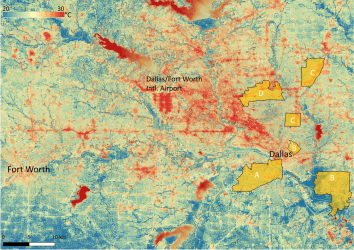
This analysis aims to understand the thermal characteristics of the Dallas- Ft. Worth metroplex and the relationship between land surface temperature, vegetation, building typologies, and its effect on everyday lifestyles. This is done using a mixed mode methodology; quantitative data gathering, and qualitative insights obtained through conversations with residents in the identified zones. This dual methodology provides a comprehensive and straightforward understanding of how lifestyle choices impact various aspects of the study. The results of this analysis are intended to identify the negative impacts urban heat islands have on citizens, and ultimately help designers establish opportunities where design can play a role in reducing heat. The neighborhoods were chosen based on the 2022 NASA Eco stress heatmap of the area 17. This stratification was established according to variations in-land surface temperature.
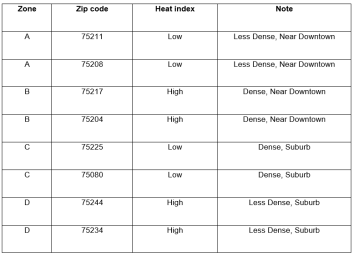
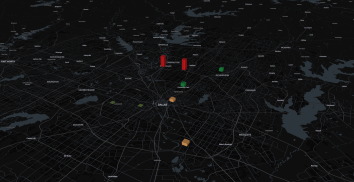
The study area was divided into two primary zones, each representing a different level of land surface temperature. Within these zones, different neighborhood and residential zip code areas were selected based on the neighborhood and urban design of the region to have a more comprehensive selection of the whole city. The geographical distribution of these locations is visually represented in Figure 7. We chose to study four distinct locations based off the areas heat index, density level, and its proximity to downtown Dallas.
A list of the areas selected are shown in table below.
Table 1:List of Study Areas
Using Google Earth Engine, we collected calibrated spatial land surface temperature (LST) data from satellite images. We analyzed multispectral imagery from the USGS's Landsat 8 program to calculate LST and the Normalized Difference Vegetation Index (NDVI), which measures vegetation vigor. This data will be combined with GIS parcel data to assess how different building types affect urban heat islands. After examining changes in thermal and vegetation characteristics from 2015 to 2023 , we identified specific locations with significant changes in LST and vegetation density. By understanding which urban design strategies affect heat islands positively or negatively, we believe designers can use this information to improve decision-making in urban design strategies.
We also interviewed 15 residents from each study area, which provided rich, qualitative insights to better inform the quantitative data. These responses were used to identify relationships between various demographic factors and the built environment and determine if a statistically significant association between two or more categorical variables exists.
Who Takes the Heat?
As Figure 8 shows, each neighborhood consists of a mixture of building types, such as single-family homes, duplexes, townhomes, and apartments, with sections A and D primarily consisting of single-family homes. Analyzing a variety of housing types, sheds light on the ways in which heat conditions impact residents' lives and inform strategies for creating more resilient and adaptive communities.

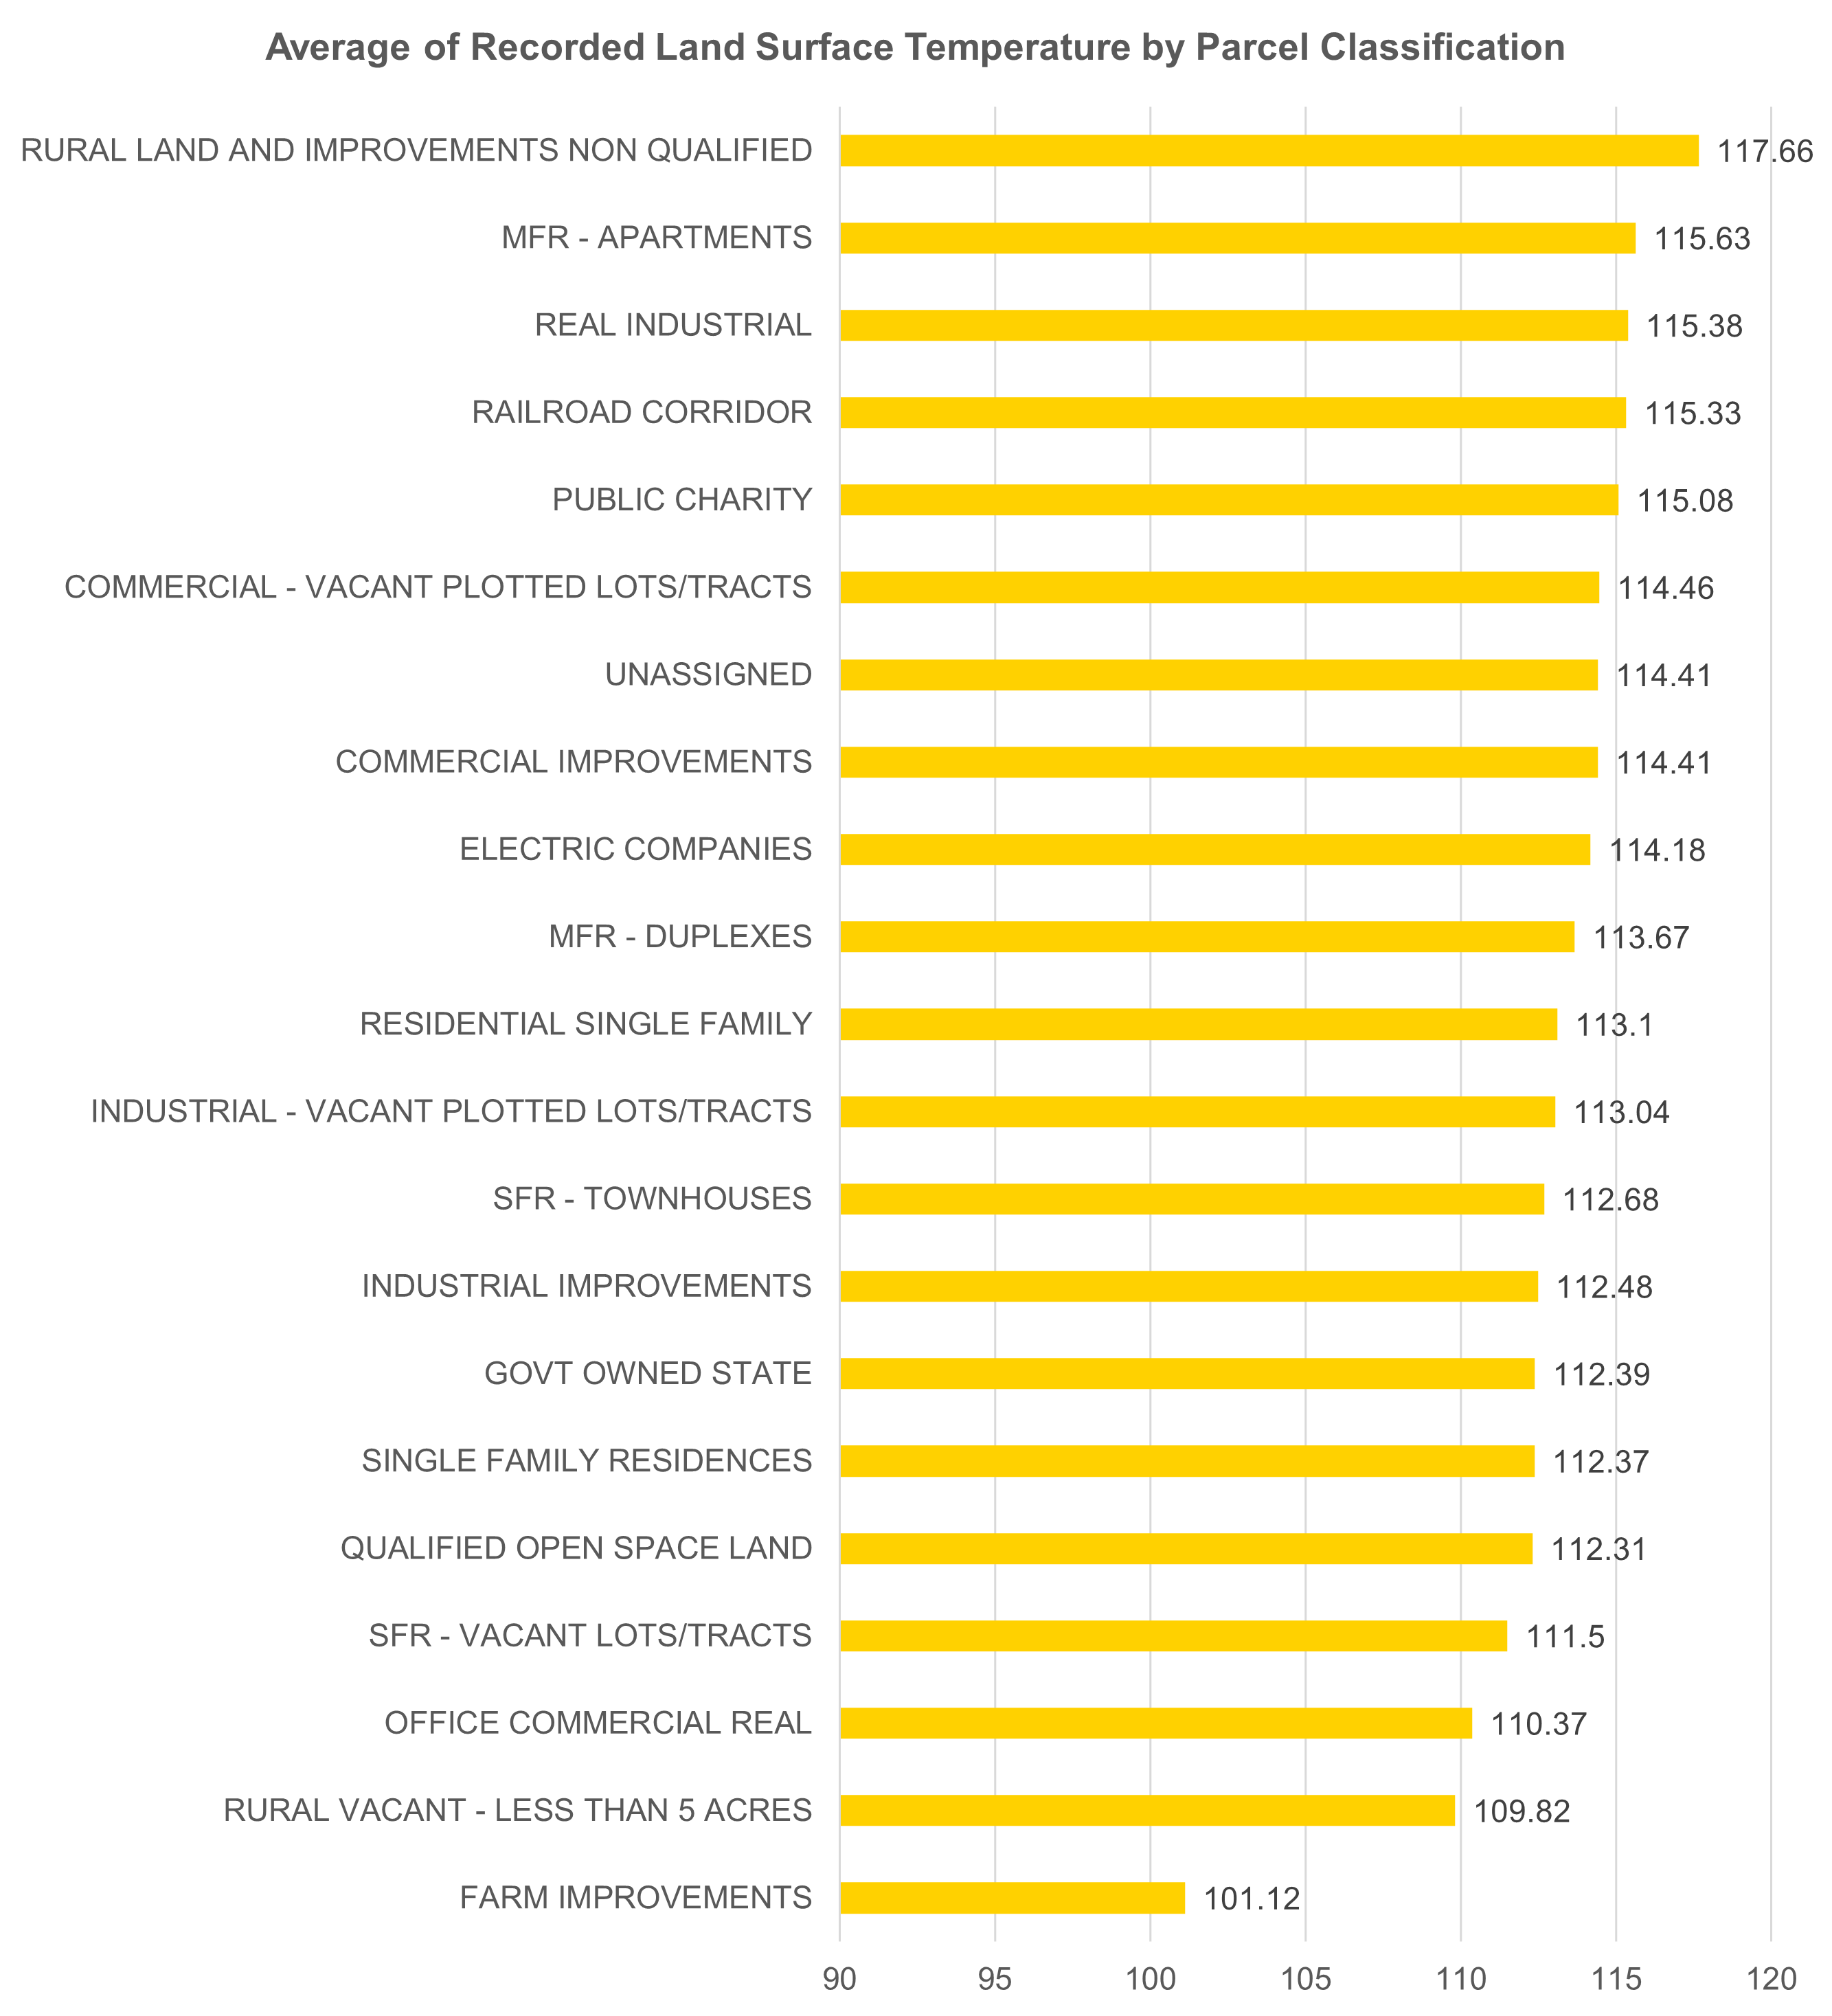
With a variety of building types, the study aimed to identify what, if any, correlation exists between the building type and the average LST. Figure 9 shows the average recorded LST based on the building type for all the zones. It is clear that open space and vegetated areas such as parks aide in reducing the LST of the site.
Next, using a Likert scale that ranged from 1 to 5, where 1 represented complete disagreement and 5 indicated strong agreement, the participants ranked the effect and magnitude of the summer heat wave on their behavior and everyday social life.
Table 2: Score of Each Behavioral Question based on Are of Study
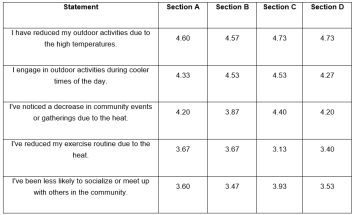
This study reveals that heat waves have significantly altered people's daily routines. Notably, the highest-rated aspect across all sections is "reduction in outdoor activities," consistently scoring above 4.5 out of 5. The figure below displays the percentage of responses based on each section's scores.
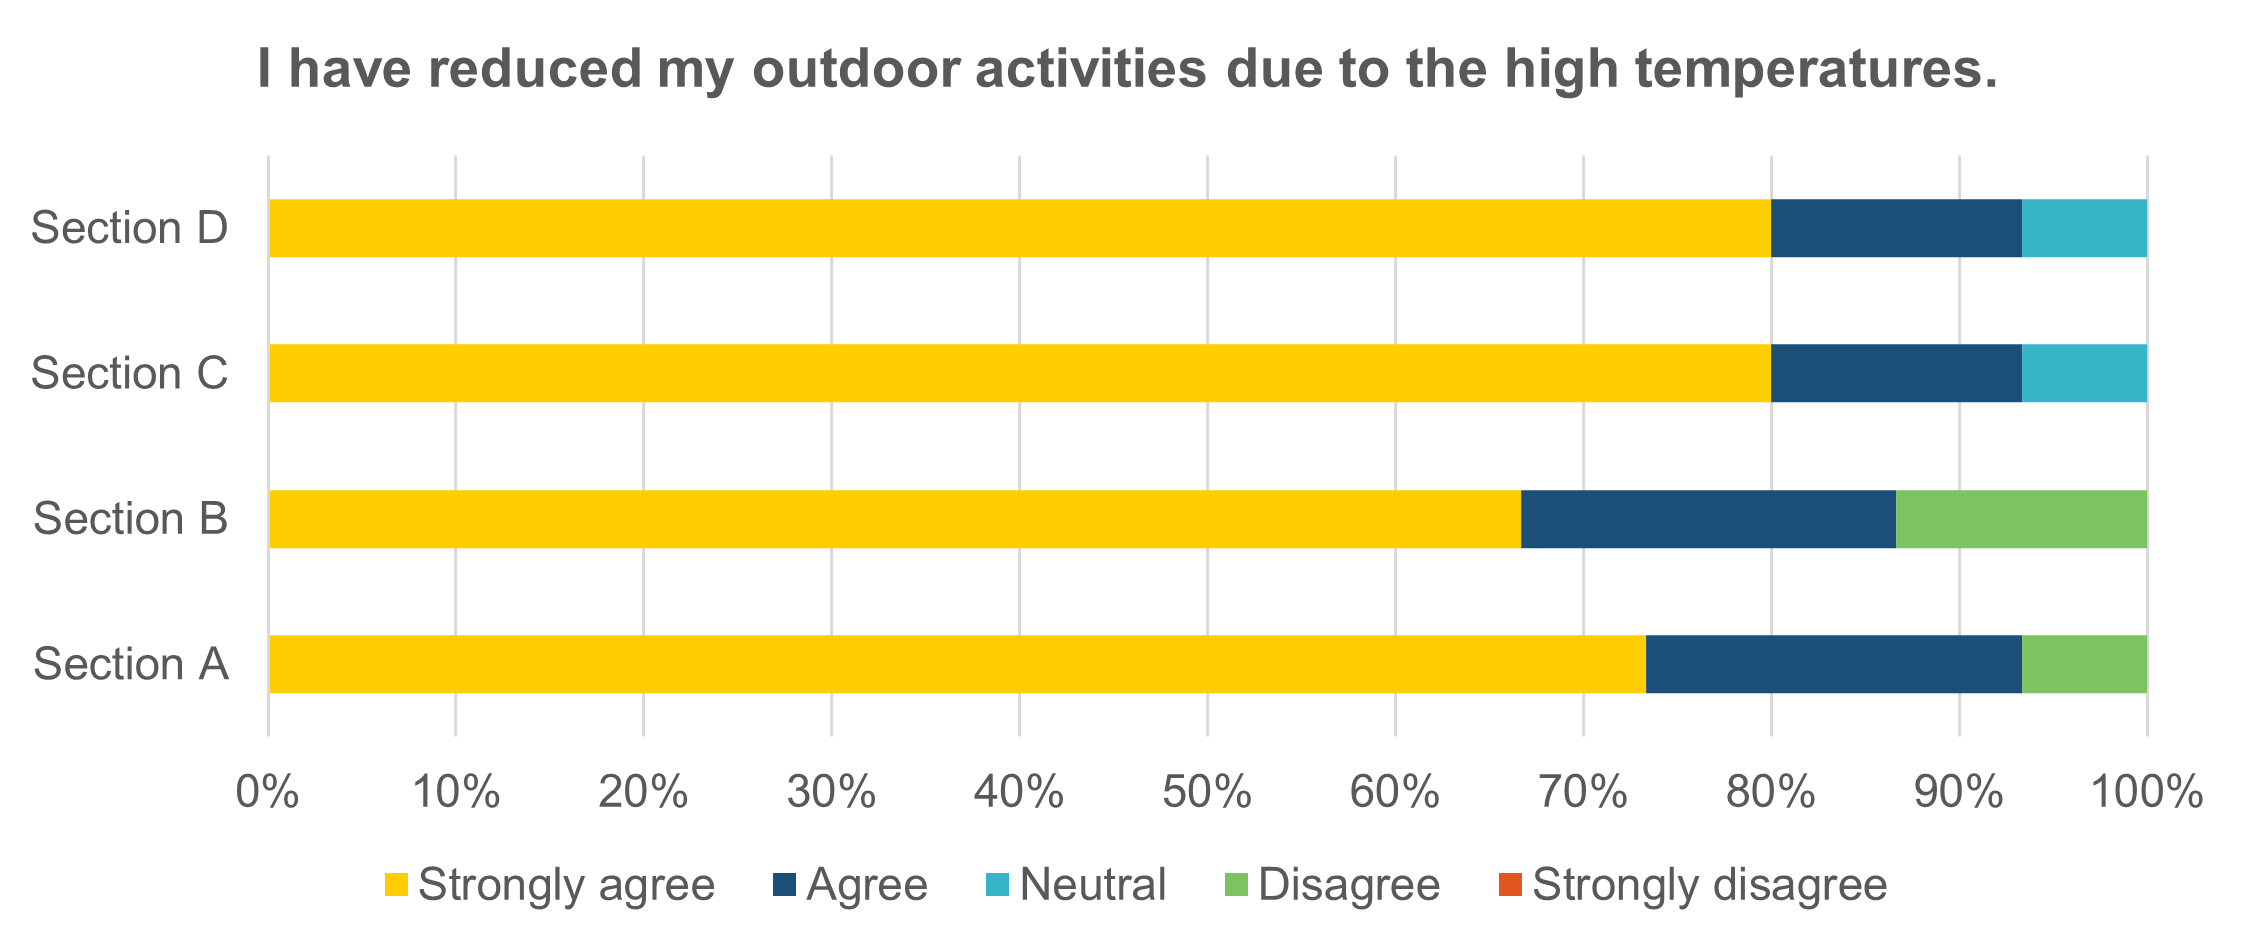
Over 90% of participants in sections A, C, and D, and over 85% in Section B, either agree or strongly agree that high temperatures have curtailed their outdoor activities.
This suggests increased indoor time, leading to higher energy consumption and potential health issues, both mentally and physically. According to the Environmental Protection Agency (EPA), indoor air pollutants are often two-to-five times higher than outdoor levels 18.
When people experience these reactions – especially those with young children – they tend to increase cooling and, consequently, electricity consumption.
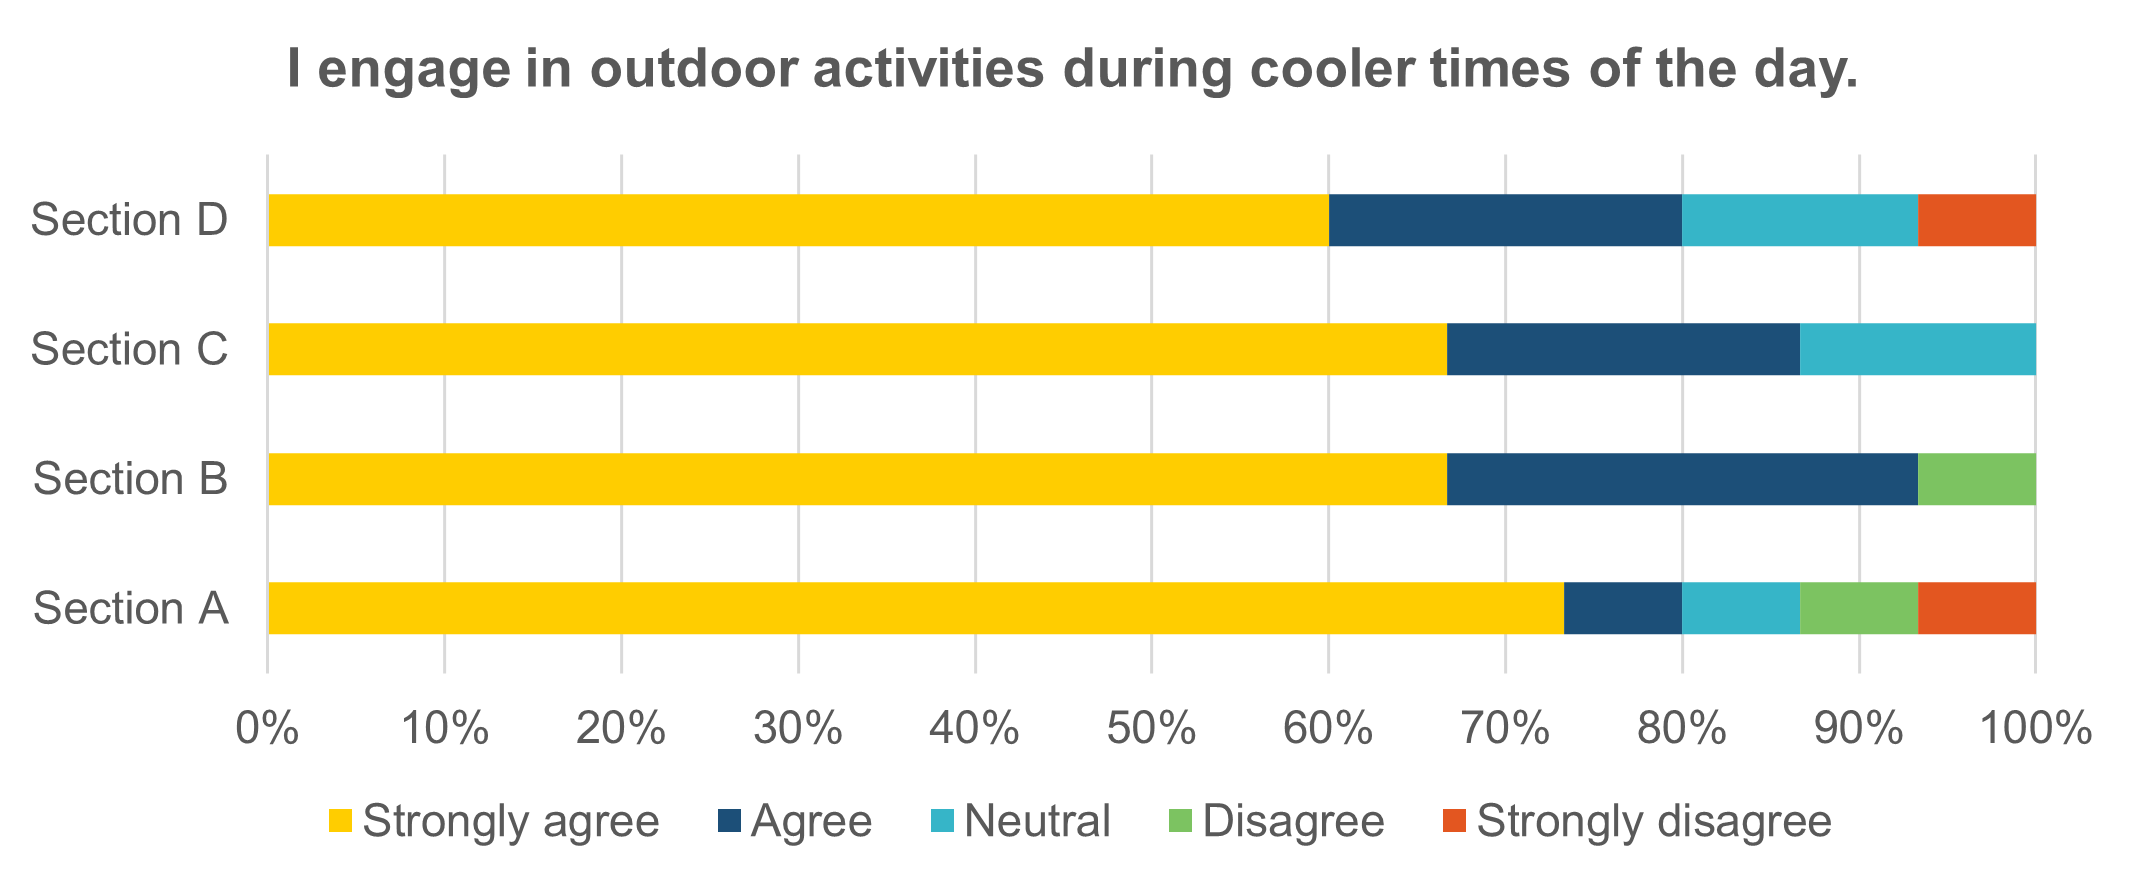
During cooler times of the day, residents living in sections B and C participate in more outdoor activities. These areas have extensive outdoor green spaces such as Crawford memorial park, Trinity River Center, and Katy Trail, which tend to lower temperatures in the neighborhood, while providing areas of interest for the residents to spend their time.
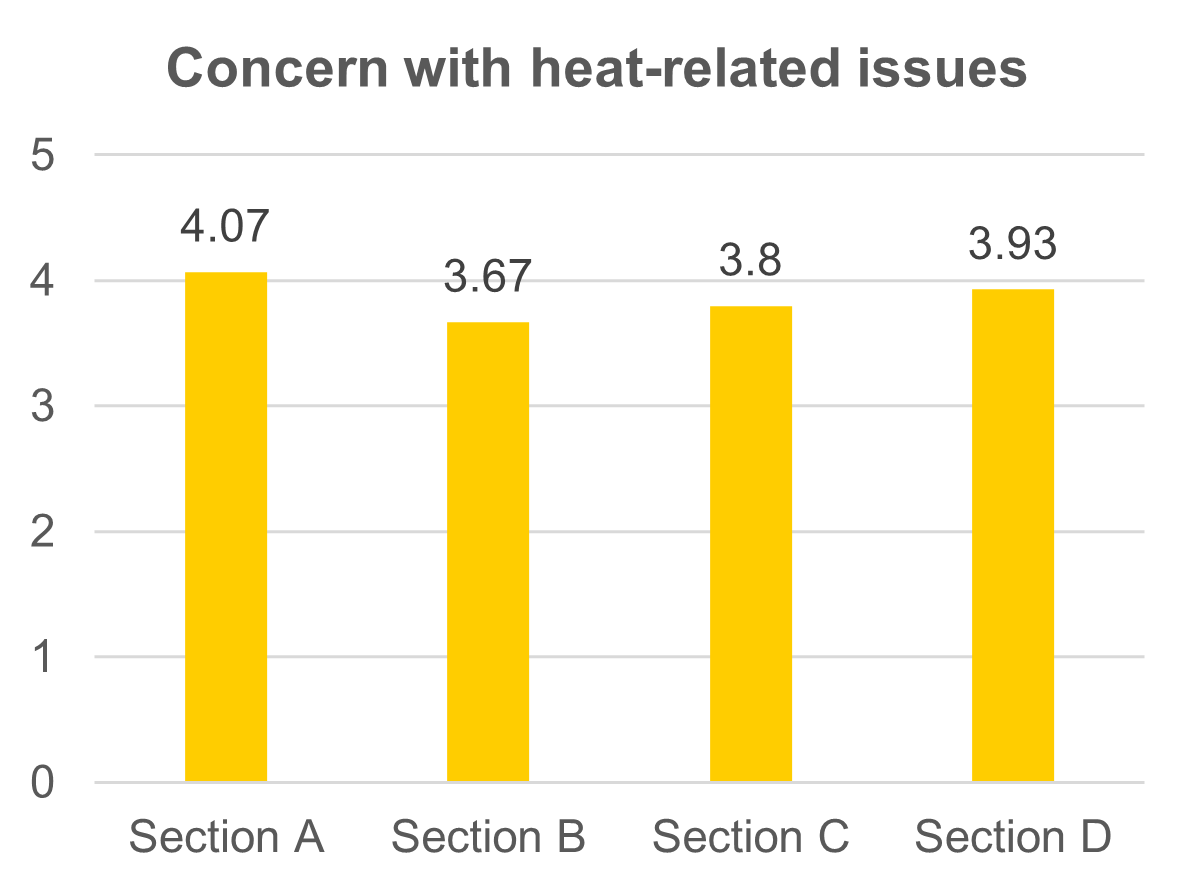
Next, participants were asked to score their level of concern with heat-related issues within their communities from 1 to 5, where 1 represented least concern and 5 represented having the most concern. It is worth mentioning that the score in each of the neighborhoods separately was higher than 3.6 out of 5, with a mean of 3.87 across the board. This shows that heat-related issues are of major concern for people living in urban environments. Also, the configuration of each neighborhood plays a statistically significant role on the magnitude of behaviors in reaction to heat waves. As shown in Figure 13, the highest scores belong to sections A and D, which have the highest ratio of single-family homes in their neighborhoods compared to other zones.
These groups also represent a higher level of health concerns due to the heat surge effect between all study areas, shown in Figure 14. This underscores how urban patterns and vegetative features in the city can change the heat effect for the people living in the area.
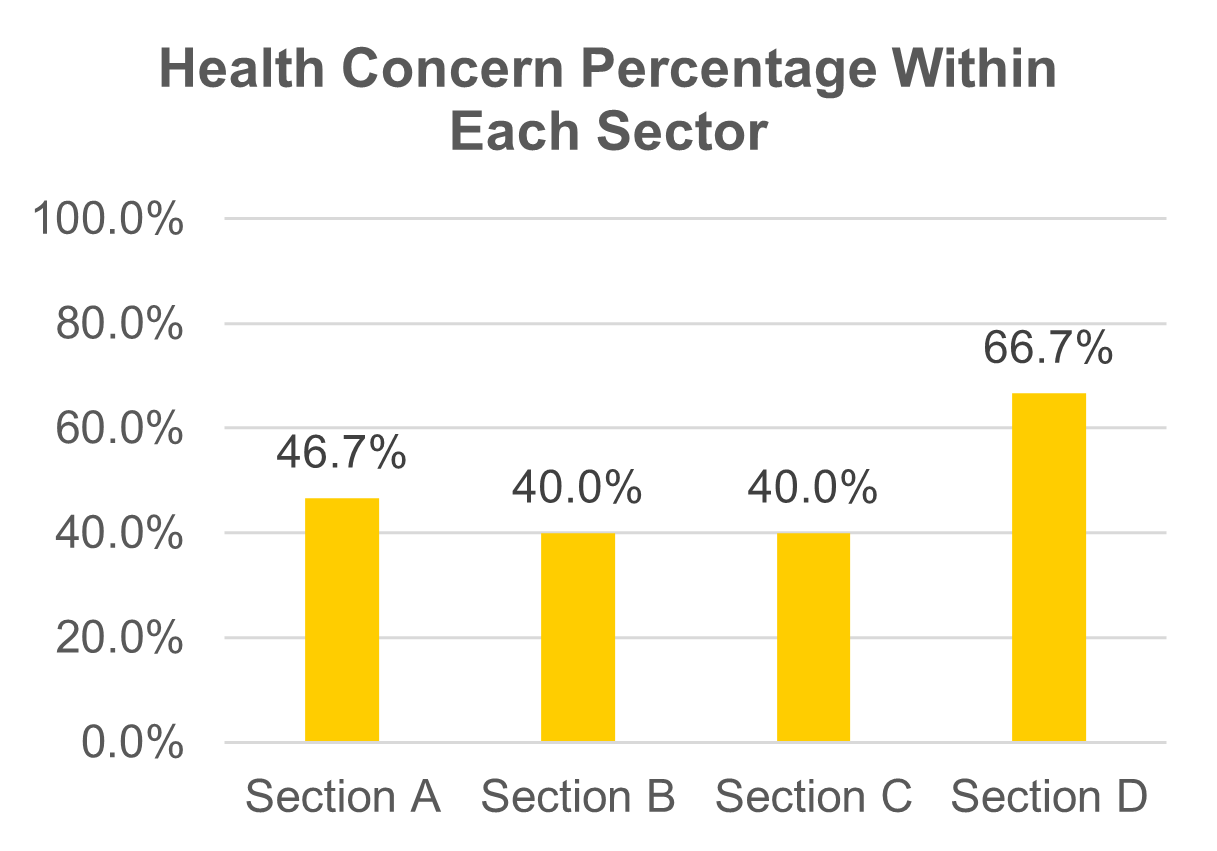
Section D residents expressed the most concern about health and outdoor discomfort during heat surges. Figure 15 illustrates LST and NDVI indexes for each zone. In the figure, height represents LST, while color indicates NDVI values, with green indicating the highest value. Zone D notably exhibits the highest LST and lowest NDVI, which corresponds with reports from residents of reduced outdoor activity during heat waves. This highlights inadequate urban planning and building design in the area, necessitating new strategies for improvement.
It would be a lot cooler if you did make changes
As previously mentioned, the NDVI index significantly influences the LST within urban areas and their surrounding communities. New construction should aim to be not just energy-efficient and carbon cautious, but also equipped to ensure people's safety amidst the escalating heatwaves. This means that it is imperative for architects, policymakers, and urban designers to incorporate more biophilic elements across various scales from the initial stages of the planning process, by introducing more green spaces, water features, enhanced shading and tree cover, and the adoption of urban design strategies that are mindful of thermal conditions. Some examples of these practices, grouped by scale of effect, are as follows:
Revive Biodiversity
Policy makers must make careful selections regarding the choice of plants and landscaping that align with the future conditions of the area. Opting for xeriscaping presents a unique advantage, as it promotes longer plant lifespans, resulting in reduced maintenance and cost. Moreover, to guard against the potential risks of extensive losses due to diseases and invasive species, it is crucial to prioritize biodiversity.
Create a Digital Twin of the Trees
This tool can help to have a digital inventory of each tree in the city and follow their health, size, and the amount of shade they provide throughout the year, collecting how they affect the nearby streets and the environment. It can help cities and community leaders identify where to invest resources for planting and maintaining trees 19.
Develop Welcoming Public Spaces
Creating green infrastructure such as open spaces within dense areas dedicated to community spaces, especially near downtown can enhance urban livability, improve social well-bring, and provide natural cooling. The Loreto urban renewal open community in Milan, Italy, aimed to be complete in 2026, is designed to have 39,000 SF of green space for public use as well as 300 new planted trees, cutting 35% of CO2 emission 20.
Introduce Permeable Pavement
While conventional roads channel rainwater into storm drains, green streets employ permeable pavement, bioswales, planter boxes, and various stormwater management methods to capture, absorb, and filter precipitation right at its source. This approach significantly reduces the volume of runoff that ultimately reaches water bodies and enhances the quality of the runoff that does. Remarkably, green streets can effectively eliminate up to 90% of stormwater pollutants. Furthermore, these green streets have the added benefit of enhancing air quality, offering shade, increasing safety for pedestrians and cyclists, and contributing to the overall aesthetic appeal of neighborhoods.
Cool Roofs
According to Department of Energy’s Lawrence Berkeley National Laboratory, cool roofs could reduce the heat wave exposure from 80 million to only 35 million by 2050,. This underscores the significant impact of cool roofs on public health and climate change mitigation, emphasizing the importance of proactive urban policies and planning to combat urban heat 21.
Green Roofs
California State University San Marcos showcased how a 2,540 SF “green” roof with vegetation can save around $2,500 annually in cooling expenses when compared to a conventional “white” roof. This cost reduction is due to the vegetation’s evapotranspiration property, which offers a cooling effect, as well as the improved insulation provided by the thick growing medium 22.
Green Façade
A UK-based study compared a building section with a “green” or biophilia wall providing additional insulation to a control section with uncovered walls. Over five weeks, the green wall demonstrated a remarkable 31.4% reduction in heat loss compared to the exposed counterpart, improving the thermal stability. This case study underscores the potential of green walls to enhance building energy efficiency and contribute to carbon reduction goals. Green walls can improve urban environments by keeping temperatures in cities bearable, making them a multifaceted solution for sustainable architecture and combating climate change 23.
Solar Panels on Roofs
In a study led by UC San Diego, using thermal imaging, they found the panels can lower the building’s ceiling temperature by 5°Fahrenheit compared to an exposed roof. The research suggested that solar panels can act as effective roof shades, significantly reducing the heat transferred to buildings while also increasing energy efficiency 24.
Data center operators are increasingly integrating solar power to address sustainability concerns and reduce costs. Solar energy reduces operating expenses, improves energy efficiency, and supports environmental goals. This transition is crucial as data center demand grows, and solar power is a pivotal technology in shaping a greener and more efficient future for the industry. Apple’s California data centers run on 100% renewable energy, with solar panels on rooftops and parking areas 25.
The Google Maps Platform Solar API offers detailed rooftop data, enabling the estimation of renewable rooftop solar energy potential and savings. It provides insights on building location, dimensions, and solar potential, raw solar datasets, and encoded solar information. Users can use this data to remotely design solar systems, save time on site assessments, choose installation locations, create accurate proposals, enhance customer conversion rates, and educate consumers about solar options 26.
Creating Community Gardens
Community gardens mitigate the urban heat island effect through shading and the absorption of solar radiation, while also assisting in the management of stormwater runoff by absorbing and storing rainwater and contributing to carbon capture from the atmosphere 27.
Reuse Waste Heat
Capturing and repurposing excess heat produced during manufacturing or other industrial activities, rather than allowing it to dissipate into the environment unused. Reuse waste heat initiatives aim to enhance energy efficiency and reduce overall environmental impact by converting this thermal energy into usable forms for heating, cooling, or generating electricity.
Efficient Zoning
Zoning the building efficiently based on the building size, use, and the different type of spaces would result in optimal space utilization and improved energy efficiency.
Crafting effective strategies in different design scales to combat heat island and rising temperatures requires a paradigm shift in design thinking, a return to the essence of design during the renaissance and prioritizing passive solutions. In an era preceding the ubiquitous use of air conditioning, we instinctively gravitated towards passive design approaches out of necessity. Today, as we confront the challenges of escalating temperatures, there is a pressing need to rediscover and wholeheartedly adopt these time-tested strategies. Embracing passive solutions is not just a nod to tradition; it is a forward-looking initiative essential for the creation of resilient and sustainable designs to navigate the heat challenges in the years ahead.
References
- Uteuova , A., & Witherspoon, A. (2023, July 21). “A bad perfect storm”: The US cities where temperatures have sizzled for 70 days. The Guardian. https://www.theguardian.com/us-news/2023/jul/21/us-heatwaves-longer-sou….
- Miller, K. (2023, August 19). Record-Setting Temperatures Forecast in Dallas as Scorching Heat Wave Continues to Bake the US. News. https://www.thestar.com/news/world/united-states/record-setting-temperatures-forecast-in-dallas-as-scorching-heat-wave-continues-to-bake-the-us/article_b42dd37f-0d97-5445-b7e3-39e787a6f2c9.html
- NOAA National Centers for Environmental Information. (2023, August 9). U.S. climate summary for July 2023. NOAA Climate. https://www.climate.gov/news-features/understanding-climate/us-climate-…;
- L, J. (2023, July 25). Climate maps of transformed United States (under 5 scenarios). Carbon Credits. https://carboncredits.com/climate-maps-of-transformed-united-states-under-5-scenarios
- Muyskens, J., Tran, A. B., Philips, A., Ducroquet, S., & Ahmed, N. (2022, August 15). Heat wave map: See where Americans face the most extreme heat risk ... Climate. https://www.washingtonpost.com/climate-environment/interactive/2022/ext…;
- First Street Foundation (August 15, 2022).The National Risk Assessment: Hazardous Heat (pg. 8) https://report.firststreet.org/6th-National-Risk-Assessment-Hazardous-Heat.pdf
- Chu , J. (2023, August 27). Explained: The 1.5 C climate benchmark. MIT News | Massachusetts Institute of Technology. https://news.mit.edu/2023/explained-climate-benchmark-rising-temperatur…;
- NASA. (2013, November 17). Climate model: Temperature change (RCP 8.5) - 2006 - 2100. Science On a Sphere. https://sos.noaa.gov/catalog/datasets/climate-model-temperature-change-rcp-85-2006-2100/
- Miniño, A. (2022, August 25). QuickStats: Deaths involving exposure to excessive heat, by sex - national vital statistics system, United States, 1999–2020. Centers for Disease Control and Prevention. https://www.cdc.gov/mmwr/volumes/71/wr/mm7134a5.htm.
- USAFacts. (2023, August 22). How many people die from extreme heat in the US? https://usafacts.org/articles/how-many-people-die-from-extreme-heat-in-…;
- American Psychiatric Association. (2023, July 20). Extreme heat can take a toll on Mental Health. Psychiatry.org - Extreme Heat Can Take a Toll on Mental Health. https://www.psychiatry.org/news-room/apa-blogs/extreme-heat-can-take-a-…;
- American Public Health Association, & Centers for Disease Control & Prevention. (2022). Extreme heat can impact our health in many ways. https://www.cdc.gov/climateandhealth/pubs/extreme-heat-final_508.pdf
- American Lung Association. (2022, June 24). Tips to save yourself from Summer’s Deadly heat waves. https://www.lung.org/blog/heat-waves
- Huang, H., Li, Y., Zhao, Y., & Zhai, W. (2022). Analysis of the impact of urban summer high temperatures and outdoor activity duration on residents' emotional health: Taking hostility as an example. Frontiers in Public Health, 10, 955077
- Vogel, K. (2023, August 28). Scientists say this is the ideal temperature range for sleeping. Healthline. https://www.healthline.com/health-news/scientists-say-this-is-the-best-…;
- National Centers for Environmental Information. (2022). U.S. Climate Normals. NOAA NCEI U.S. Climate Normals Quick Access. https://www.ncei.noaa.gov/access/us-climate-normals/#dataset=normals-daily&timeframe=30&location=TX&station=USW00003971&month=11.
- NASA, & JPL-Caltech. (2022). NASA’s ECOSTRESS shows heat in Dallas and Fort Worth. NASA. https://www.jpl.nasa.gov/images/pia25422-nasas-ecostress-shows-heat-in-…;
- U.S. Environmental Protection Agency. (2023, July 14). What Are the Trends in Indoor Air Quality and Their Effects on Human Health?. EPA. https://www.epa.gov/report-environment/indoor-air-quality
- Brandt, K. (2023, March 29). How we’re helping people and cities adapt to extreme heat. Google. https://blog.google/outreach-initiatives/sustainability/extreme-heat-support/.
- Nhood. (2021, November 4). Ceetrus nhood wins the tender for the urban renewal of Piazzale Loreto in Milan with the “Loreto Open Community” Project. Nhood Services Italy. https://nhood.it/en/comunicati-stampa/ceetrus-nhood-wins-the-tender-for…;
- Priyanka, R. (2019, August 15). Cool roofs can help shield California’s cities against heat waves. Berkeley Lab News Center. https://newscenter.lbl.gov/2019/08/14/cool-roofs-can-help-shield-californias-cities-against-heat-waves/
- Andrews III, C. (2016). Case Study: An Effective Model for Green Roofs in San Diego County
- Micu, A. (2021, November 25). Green walls can reduce heat lost by buildings by over 30% in temperate climates. ZME Science. https://www.zmescience.com/science/green-walls-can-reduce-heat-lost-by-buildings-by-over-30-in-temperate-climates/
- Dominguez, A., Kleissl, J., & Luvall, J. C. (2011). Effects of solar photovoltaic panels on roof heat transfer. Solar Energy, 85(9), 2244-2255.
- Energy5. (2023, August 23). Solar power empowering data center expansion and scalability. https://energy5.com/solar-power-empowering-data-center-expansion-and-scalability
- Google. (2023, October). Google Maps Platform Solar API Overview. https://developers.google.com/maps/documentation/solar/overview
- Kyrkjebo, N. (2020, June 18). A secret tool to slow climate change in New York City. MA in Climate and Society. https://climatesociety.ei.columbia.edu/news/secret-tool-slow-climate-change-new-york-city